Funny use of textPath
svg tag.
I was thinking about to use it in a feature about global warming at the end of 2016. The textPath
will follow the cursor along the path when the mouseover event is thrown.
Its a cool effect when you have a smooth line but not when the data is too much variable or irregular. So use of the feature doesnt have any sense.
The following pictures show how textPath
works:
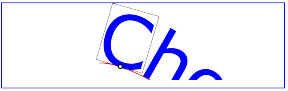
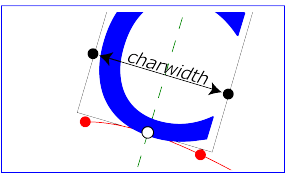
"The small dot above shows the point at which the glyph is attached to the path. The box around the glyph shows the glyph is rotated such that its horizontal axis is parallel to the tangent of the curve at the point at which the glyph is attached to the path. The box also shows the glyph's charwidth (i.e., the amount which the current text position advances horizontally when the glyph is drawn using horizontal text layout)." W3C doc
Can see live how textPath
works here.
xxxxxxxxxx
<html>
<head>
<meta charset="utf-8">
<style>
body {font: 12px sans-serif;}
.axis-annotation,
.axis text {
text-shadow: -1px -1px 1px #ffffff, -1px 0px 1px #ffffff, -1px 1px 1px #ffffff, 0px -1px 1px #ffffff, 0px 1px 1px #ffffff, 1px -1px 1px #ffffff, 1px 0px 1px #ffffff, 1px 1px 1px #ffffff;
font-size: 12px;
}
.axis path,
.axis line {
fill: none;
stroke: #afaeae;
stroke-linejoin: round;
pointer-events: none;
}
.focus circle {
stroke: rgba(255,255,255,0.9);
stroke-width: 2;
}
.label-bg, .label-date-bg {
fill: white;
stroke: white;
stroke-width:4;
opacity: 0.9;
}
.label-date, .label-date-bg {
font-weight: bold;
}
.textpath {
font-size: 16px;
letter-spacing: 1px;
opacity: 0.5;
}
.left { text-anchor: start; }
.right { text-anchor: end; }
.domain { display: none; }
</style>
</head>
<body>
<div id="graph"></div>
<script src="d3.v4.min.js"></script>
<script type="text/javascript">
var margin = { top: 30, right: 10, bottom: 35, left: 30 },
width = 960 - margin.left - margin.right,
height = 500 - margin.top - margin.bottom,
bisectDate = d3.bisector(function(d) { return d.date; }).left,
months = d3.timeFormat("%B");
xScale = d3.scaleTime()
.rangeRound([0, width]);
yScale = d3.scaleLinear()
.rangeRound([height, 0]);
d3.json("data.json", function(error, data) {
if (error) throw error;
data.forEach(function(d){
d.date = new Date(d.date);
})
xScale.domain([new Date("Fri Jan 01 2016 00:00:00 GMT+0100 (CET)"), new Date("Sat Dec 31 2016 00:00:00 GMT+0100 (CET)")]);
yScale.domain([0, 18]);
var line = function(accessor) {
return d3.line()
.x(function(d) { return xScale(new Date(d.date)); })
.y(function(d){ return yScale(d[accessor]); })
.defined(function(d) { return d[accessor]; })
.curve(d3.curveBasis)
}
area = d3.area()
.x(function(d) { return xScale(new Date(d.date)); })
.y0(function(d) { return yScale(d.low); })
.y1(function(d) { return yScale(d.high); });
var svg = d3.select("#graph").append("svg")
.attr("width", width + margin.left + margin.right)
.attr("height", height + margin.top + margin.bottom)
.append("g")
.attr("transform", "translate(" + margin.left + "," + margin.top + ")");
var lines = svg.append("g").attr('class', 'line');
area = lines.append("path").datum(data)
.attr("class", "line-area")
.attr('fill', '#ebebeb')
.attr('stroke', 'none')
.attr("d", area)
.attr("pointer-events", "none");
line1 = lines.append("path").datum(data)
.attr("class", "line-average")
.attr('id', 'path-avg')
.attr('stroke', '#018291')
.attr('fill', 'none')
.attr('stroke-width', '2')
.attr("d", line("avg"))
.attr("pointer-events", "none");
line2 = lines.append("path").datum(data)
.attr("class", "line-2016")
.attr('id', 'path-2016')
.attr('stroke', '#910f00')
.attr('fill', 'none')
.attr('stroke-width', '2')
.attr("d", line("temp_2016"))
.attr("pointer-events", "none");
// x-axis
svg.append("g")
.attr("class", "axis axis--x")
.attr("transform", "translate(0," + (height + 10) + ")")
.call(d3.axisBottom(xScale)
.ticks(8));
// y-axis
svg.append("g")
.attr("class", "axis axis--y")
.call(d3.axisLeft(yScale))
.append("text")
.attr("fill", "#000")
.attr("transform", "rotate(-90)")
.attr("y", 6)
.attr("dy", "0.71em")
.style("text-anchor", "end")
.attr('class', 'axis-annotation')
.text("Arctic Sea ice extent (Millions of km²)");
var textPaths = svg.append("g").attr('class', 'textPaths');
textPaths.append("text")
.attr("dy", -10)
.attr("dx", -45)
.append("textPath")
.attr("class", "textpath tp_avg")
.attr('fill', '#018291')
.attr("startOffset","55.76%")
.style("text-anchor","end")
.attr("xlink:href", "#path-avg")
.text("average extent");
textPaths.append("text")
.attr("dy", 20)
.attr("dx", -45)
.append("textPath")
.attr("class", "textpath tp_2016")
.attr('fill', '#910f00')
.attr("startOffset","55.76%")
.style("text-anchor","end")
.attr("xlink:href", "#path-avg")
.text("2016 extent");
svg.append("line")
.attr('x1', 0)
.attr('x2', 0)
.attr('y1', yScale(0))
.attr('y2', yScale(18))
.attr('stroke-width', '0.5')
.attr('class', 'lineMark')
.attr('stroke', 'rgb(110, 110, 110)')
.attr('stroke-dasharray', '3.3')
.attr('display', 'none')
////////////////////////////////
focus = svg.append("g")
.attr("class", "focus")
.style("display", "none");
focusAvg = focus.append("g").attr('class', 'focusAvg')
focus2016 = focus.append("g").attr('class', 'focus2016')
focusDate = focus.append("g").attr('class', 'focusDate')
focusAvg.append("circle")
.attr('fill', '#018291')
.attr("r", 4);
focusAvg.append("text")
.attr('class', 'label-bg')
.attr("x", 9)
.attr("dy", ".35em");
focusAvg.append("text")
.attr('class', 'label')
.attr("x", 9)
.attr("dy", ".35em");
focusDate.append("text")
.attr('class', 'label-date-bg')
.attr("x", 9)
.attr("dy", "-1em");
focusDate.append("text")
.attr('class', 'label-date')
.attr("x", 9)
.attr("dy", "-1em");
/////////////////////////////
focus2016.append("circle")
.attr('fill', '#910f00')
.attr("class", "focusAvg")
.attr("r", 4);
focus2016.append("text")
.attr('class', 'label-bg')
.attr("x", 9)
.attr("dy", ".35em");
focus2016.append("text")
.attr('class', 'label')
.attr("x", 9)
.attr("dy", ".35em");
svg.append("rect")
.attr("class", "overlay")
.attr("width", width)
.attr("height", height)
.attr('fill', 'none')
.attr('pointer-events', 'all')
.on("mouseover", function() { focus.style("display", null); })
.on("mouseout", mouseout)
.on("mousemove", mousemove);
function mousemove(z) {
//mostly from https://bl.ocks.org/mbostock/3902569
var xValue = d3.mouse(this)[0],
x0 = xScale.invert(xValue);
var i = bisectDate(data, x0, 1),
d0 = data[i - 1],
d1 = data[i];
d = x0 - d0.date > d1.date - x0 ? d1 : d0;
d3.selectAll(".lineMark")
.attr('x1', xScale(d.date))
.attr('x2', xScale(d.date))
.attr('y2', yScale(d.avg))
.attr('display', 'block');
focusAvg.attr("transform", "translate(" + xScale(d.date) + "," + yScale(d.avg) + ")");
focusDate.attr("transform", "translate(" + xScale(d.date) + "," + yScale(d.avg) + ")");
focus2016.attr("transform", "translate(" + xScale(d.date) + "," + yScale(d.temp_2016) + ")");
var percent = (xValue / width) * 100,
offset = Math.max(percent, 18);
d3.selectAll(".textpath").attr("startOffset", offset+"%");
d3.selectAll(".label, .label-bg, .label-date, .label-date-bg").attr("x", function(){
if (xValue > 810) {
focus.classed("left", false);
focus.classed("right", true);
return -10;
}else {
focus.classed("left", true);
focus.classed("right", false);
return 10;
}
});
focusAvg.select(".label").text(d.avg+" km²");
focus2016.select(".label").text(d.temp_2016+" km²");
focusAvg.select(".label-bg").text(d.avg+" km²");
focus2016.select(".label-bg").text(d.temp_2016+" km²");
focusDate.select(".label-date").text(months(d.date) + " " + d.date.getDate());
focusDate.select(".label-date-bg").text(months(d.date) + " " + d.date.getDate());
}
function mouseout(d) {
d3.selectAll(".annotation").attr('display', 'block');
d3.selectAll(".textpath").attr("startOffset", "55.76%");
focus.style("display", "none");
d3.selectAll(".lineMark").attr('display', 'none')
}
});
</script>
</body>
</html>