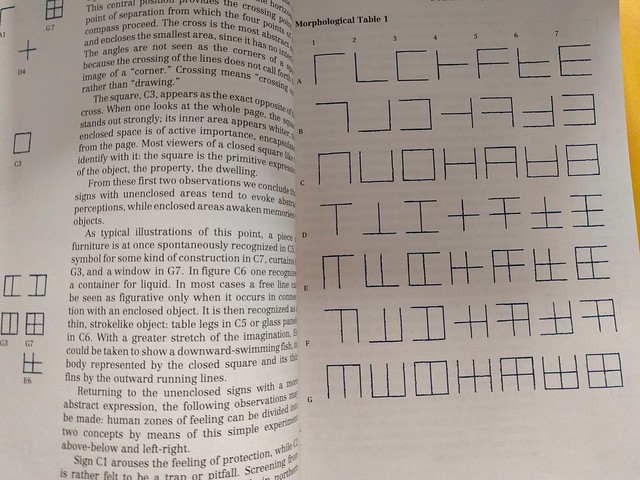
d3 | Morphological Table 1
This sketch is inspired from reading the amazing typographer Adrian Frutiger writings on morphology of signs and his first example table, Morphological Table 1.
The viewer's attitude toward a figure is very complex. In order to understand the procedure of taking in the meaning it is necessary to begin with a diagram with simple divisions, ... The diagram figures are built up from three vertical and three horizontal lines, which, when superimposed, alternately touch, cross, and supplement one another. Mathematically, 49 variants (7*7) can be produced with these six strokes. We call this procedure the completion of a program, seeking out all the possibilities contained in a given structure
[source: p.33 Signs and Symbols: Their Design and Meaning, Adrian Frutiger]

notes:
- d3 code is generating all the buttons
- the user can both hover for quick viewing and click to hold the view (which can be toggled off) using
pointer-events - the 49 views are drawn from filtering the data