Baseball Demographics with Interaction
Makeover Monday - Week 6
Original visualization
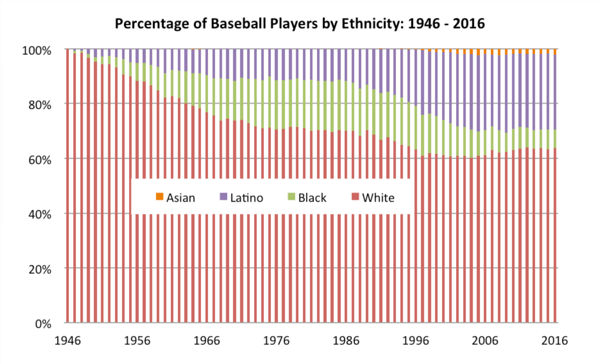
The Society for American Baseball created a 100% area chart displaying the pecent share between four ethnicities: White, African American, Asian, and Latino from 1947 to 2016. In honor of Black History month the #MakeoverMonday community is taking a stab at presenting this data differently to explore a few more ways one might looks at this data.
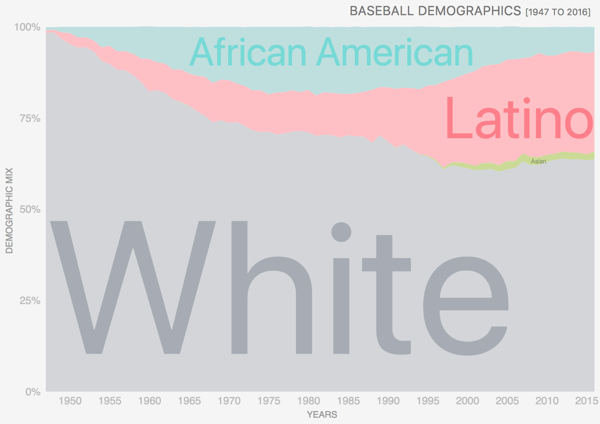
Instead of doing a pure makeover of the original visualization this week I want to remake Ann Jackson's visualization in D3.js. Why recreate the wheel, when Ann's done such a good job of making a beautiful display of the data already 😍
Ann's Visualization
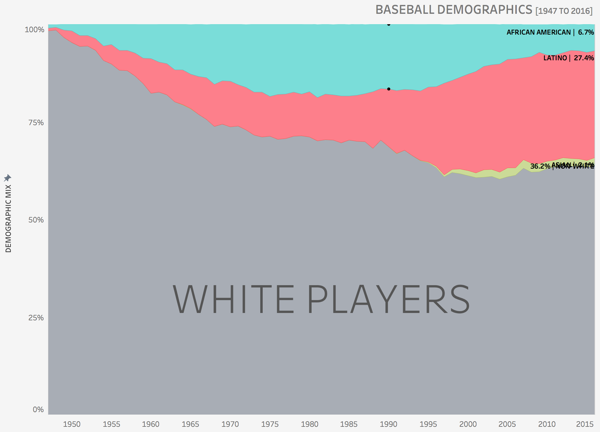
Now, I might not get to all the cool interactivey in her Tableau viz, but I can at least create another good looking area chart. D3 is another animal when it come to visualizing data. By remaking others work we can get some good training laps in with this powerful JavaScript library.
What I did
What's going on here:
- Stack Layout
- Area Labels
- Object Oriented D3
Stack Layout When you build unconventional charts with D3, such as this stacked area chart you have layouts to help you. The stack layout requires a very specific data structure which you'll see documented extensively in the docs... and still be completely confused by exactly how it works, ha. I'll try to put a post together upacking this piece more deeply.
Area Labels This is nothing short of magic. My buddy and now D3 coach Curran Kelleher created a package with accompanying documentation I leveraged to programatically position and size text inside their respective layers. If you need to intelligently place text inside areas, then you should consider Curran's package.
Object Oriented D3 I am no JavaScript pro, but from my experience developing with D3 feels a little wild wild west. Everyone does it a little differently for their own mysterious development environment. Thankfully I stumbled across a post by Elliot Bently taking advantage of somewhat new features found in JavaScript to add much needed structure to our D3 code. You can read his well written article, A better way to structure D3 code and see how I put his concept to use in my code this week. I will be leveraging his approach in future makeovers.
If you like learning about data visualization, I encourage you to follow me on Twitter @robcrock where you can catch what I'm Tweeting about. Spoiler alert, it's almost always data visualization.
Acknowledgments
This project would be what it is without the efforts of Andy Kriebel and Eva Murray, so be sure to give a shout out.
Built With
- D3v4 - JavaScript visualization kernel
- Materialize CSS - Based on Google's design philosophy
- Materialize JS- Materialize dependancy
License
This project is licensed under the MIT License - see the LICENSE.md file for details