MSAN 622, Project 1 Piyush Bhargava
Part 1 - SF per capita income trend - Source dataset
Part 2 - U.S. Presidential Elections 2012 -
The Data comes from Federal Election Commission's website:Federal Elections 2012: Election Results for the U.S. President
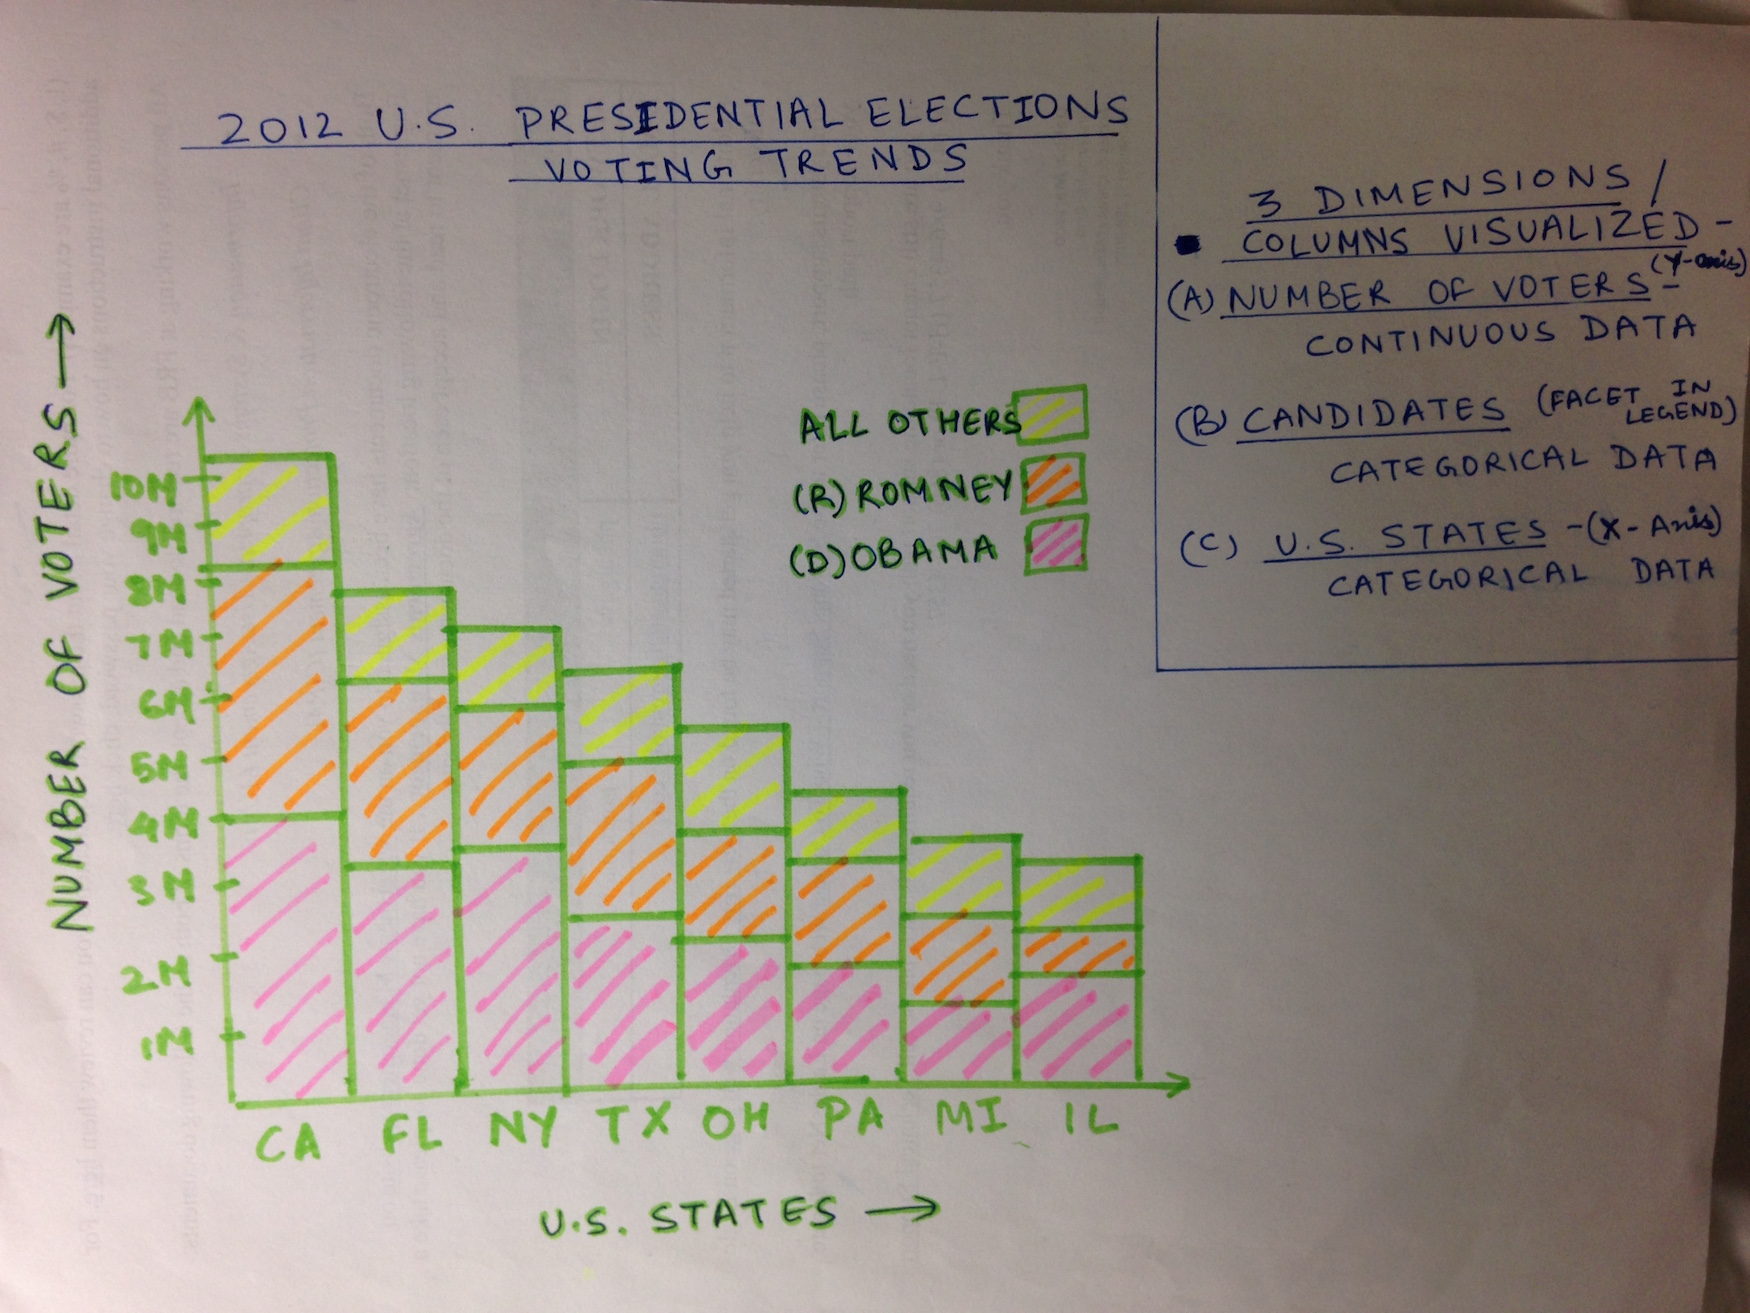
A hand drawn prototype sketch of a visualization
Three dimensions/columns visualized are:
Requirements:
xxxxxxxxxx
<meta charset="utf-8">
<style>
body {
font: 10px sans-serif;
}
.title {
font: bold 20px "Helvetica Neue", Helvetica, Arial, sans-serif;
}
.axis path,
.axis line {
fill: none;
stroke: #000;
shape-rendering: crispEdges;
}
.bar {
fill: steelblue;
}
.x.axis path {
display: none;
}
</style>
<body>
<script src="//d3js.org/d3.v3.min.js"></script>
<script>
var margin = {top: 20, right: 20, bottom: 30, left: 40},
width = 960 - margin.left - margin.right,
height = 500 - margin.top - margin.bottom;
var x = d3.scale.ordinal()
.rangeRoundBands([0, width], .1);
var y = d3.scale.linear()
.rangeRound([height, 0]);
var color = d3.scale.ordinal()
.range(["#5b3d5b", "#7fc97f"," #ff8c00"]);
var xAxis = d3.svg.axis()
.scale(x)
.orient("bottom");
var yAxis = d3.svg.axis()
.scale(y)
.orient("left")
.tickFormat(d3.format(".2s"));
var svg = d3.select("body").append("svg")
.attr("width", width + margin.left + margin.right)
.attr("height", height + margin.top + margin.bottom)
.append("g")
.attr("transform", "translate(" + margin.left + "," + margin.top + ")");
d3.csv("https://piyushbhargava7.github.io/data_1.csv", function(error, data) {
if (error) throw error;
color.domain(d3.keys(data[0]).filter(function(key) { return key !== "State"; }));
data.forEach(function(d) {
var y0 = 0;
d.candidates = color.domain().map(function(name) { return {name: name, y0: y0, y1: y0 += +d[name]}; });
d.total = d.candidates[d.candidates.length - 1].y1;
});
data.sort(function(a, b) { return b.total - a.total; });
x.domain(data.map(function(d) { return d.State; }));
y.domain([0, d3.max(data, function(d) { return d.total; })]);
svg.append("g")
.attr("class", "x axis")
.attr("transform", "translate(0," + height + ")")
.call(xAxis)
.append("text")
.attr("x", 850)
.attr("dy", "2.25em")
.style("text-anchor", "end")
.text("States");
svg.append("g")
.attr("class", "y axis")
.call(yAxis)
.append("text")
.attr("transform", "rotate(-90)")
.attr("y", 6)
.attr("dy", ".71em")
.style("text-anchor", "end")
.text("Number of Voters");
svg.append("text")
.attr("class", "title")
.attr("x", 300)
.attr("y", 15)
.text("2012 US Presidential Election Voting trends");
var state = svg.selectAll(".state")
.data(data)
.enter().append("g")
.attr("class", "g")
.attr("transform", function(d) { return "translate(" + x(d.State) + ",0)"; });
state.selectAll("rect")
.data(function(d) { return d.candidates; })
.enter().append("rect")
.attr("width", x.rangeBand())
.attr("y", function(d) { return y(d.y1); })
.attr("height", function(d) { return y(d.y0) - y(d.y1); })
.style("fill", function(d) { return color(d.name); });
var legend = svg.selectAll(".legend")
.data(color.domain().slice().reverse())
.enter().append("g")
.attr("class", "legend")
.attr("transform", function(d, i) { return "translate(0," + i * 20 + ")"; });
legend.append("rect")
.attr("x", width - 18)
.attr("width", 18)
.attr("height", 18)
.style("fill", color);
legend.append("text")
.attr("x", width - 24)
.attr("y", 9)
.attr("dy", ".35em")
.style("text-anchor", "end")
.text(function(d) { return d; });
});
</script>
https://d3js.org/d3.v3.min.js