Data Table Summary
About this dataset
This is less of a visualization than an example of using Datalib to get quick summary statistics on a data. You can fork this Block and change the data to get a quick overview of the shape of your data.
I first ran across this dataset in Week 2 of MakeoverMonday 2018...
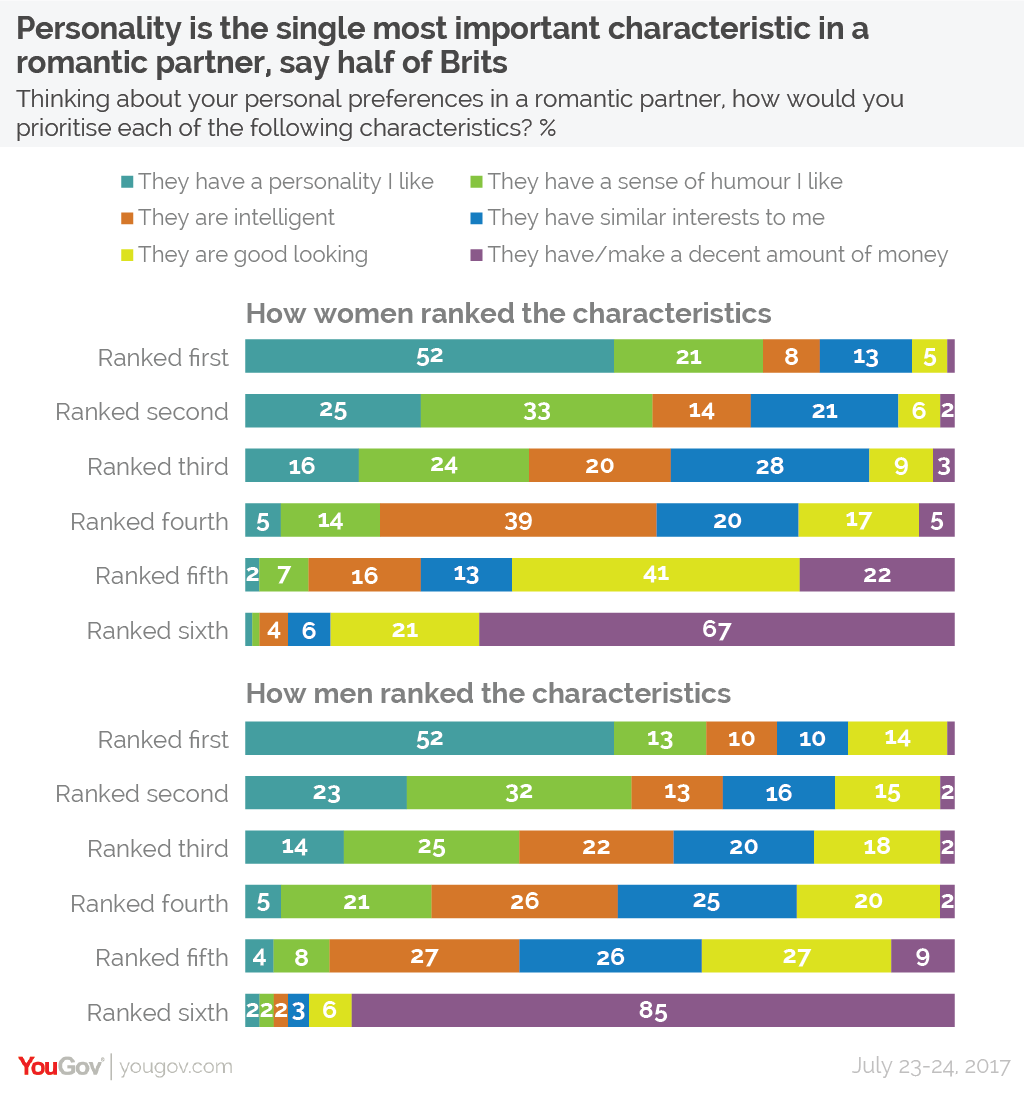
The dataset captures the romantic preferences of women and men from 20 countries around the world. The participants of this survey were asked to give a rank between 1 (highest priority) and 6 (lowest priority) to 6 different qualities of potential suitor.
It can be interesting to use this dataset to try and see what how the priority of characteristic vary by country and gender.
To get even more information around this dataset you can read the original article where it was featured.
All of the surveys were conducted online, and in many of the countries the internet penetration is low to the point where the sample can only be said to be representative to the online population. The countries where the online population is lower than 60% of the total are Egypt, India, Indonesia, Philippines, Saudi Arabia, Thailand and Vietnam.
License & Attribution
The data is free for you to use, but at least give Matthew Smith and YouGov a shout out if you find a fun way to put this data to use.
forked from curran's block: Data Table Summary